Confirming you are not from the U.S. or the Philippines

এই বিবৃতি দিয়ে, আমি স্পষ্টভাবে ঘোষণা এবং নিশ্চিত করছি যে:
  • আমি মার্কিন নাগরিক বা অধিবাসী নই
  • আমি ফিলিপাইনের বাসিন্দা নই
  • আমি প্রত্যক্ষ বা অপ্রত্যক্ষভাবে মার্কিন অধিবাসীদের10% এর বেশি শেয়ার/ ভোটাধিকার/ স্বার্থের মালিক নই এবং/ অথবা মার্কিন নাগরিকদের বা অদিবাসীদের অন্য উপায়ে নিয়ন্ত্রণ করি না
  • আমি শেয়ার/ ভোটাধিকার/ স্বার্থের 10% এরও বেশি বা প্রত্যক্ষ বা অপ্রত্যক্ষ মালিকানার আওতাধীন নই/ বা অন্য উপায়ে মার্কিন নাগরিক বা অধিবাসীদের নিয়ন্ত্রণে নেই
  • আমি FATCA-র ধারা 1504(a) অনুযায়ী মার্কিন যুক্তরাষ্ট্রের নাগরিকদের সাথে বা অধিবাসীদের সাথে সম্বন্ধযুক্ত নই
  • আমি মিথ্যা বিবৃতি দেওয়ার জন্য আমার দায়বদ্ধতা সম্পর্কে সচেতন।
এই বিবৃতিটির উদ্দেশ্যে, সমস্ত মার্কিন নির্ভরশীল দেশ এবং অঞ্চলগুলি মার্কিন যুক্তরাষ্ট্রের মূল ভূখণ্ডের সমান। আমি Octa মার্কেটস ইনকর্পোরেটেডকে, এর পরিচালক এবং আধিকারিকদের আমার বিবৃতি লঙ্ঘনের কারণে উত্থিত বা এর সাথে সম্পর্কিত যে কোনও দাবি মোকাবেলা করার বিরুদ্ধে তাদের রক্ষা করতে এবং নির্দোষ প্রমাণ করতে প্রতিশ্রুতিবদ্ধ।
আমরা আপনার গোপনীয়তা এবং আপনার ব্যক্তিগত তথ্যের নিরাপত্তার জন্য নিবেদিত। আমরা শুধুমাত্র আমাদের পণ্য এবং পরিষেবা সম্পর্কে বিশেষ অফার এবং গুরুত্বপূর্ণ তথ্য প্রদানের জন্য ইমেইল সংগ্রহ করি। আপনার ইমেইল ঠিকানা জমা দিয়ে, আপনি আমাদের কাছ থেকে এই ধরনের বার্তা পেতে সম্মত হোন। আপনি যদি সদস্যতা ত্যাগ করতে চান বা কোনো প্রশ্ন বা উদ্বেগ থাকলে, আমাদের গ্রাহক সহায়তায় লিখুন।
Octa trading broker
ট্রেডিং অ্যাকাউন্ট খুলুন
Back

EUR/USD Price Analysis: Trades below 1.08, eyes trendline support

  • EUR/USD's three-day drop has put the focus on key trendline support. 
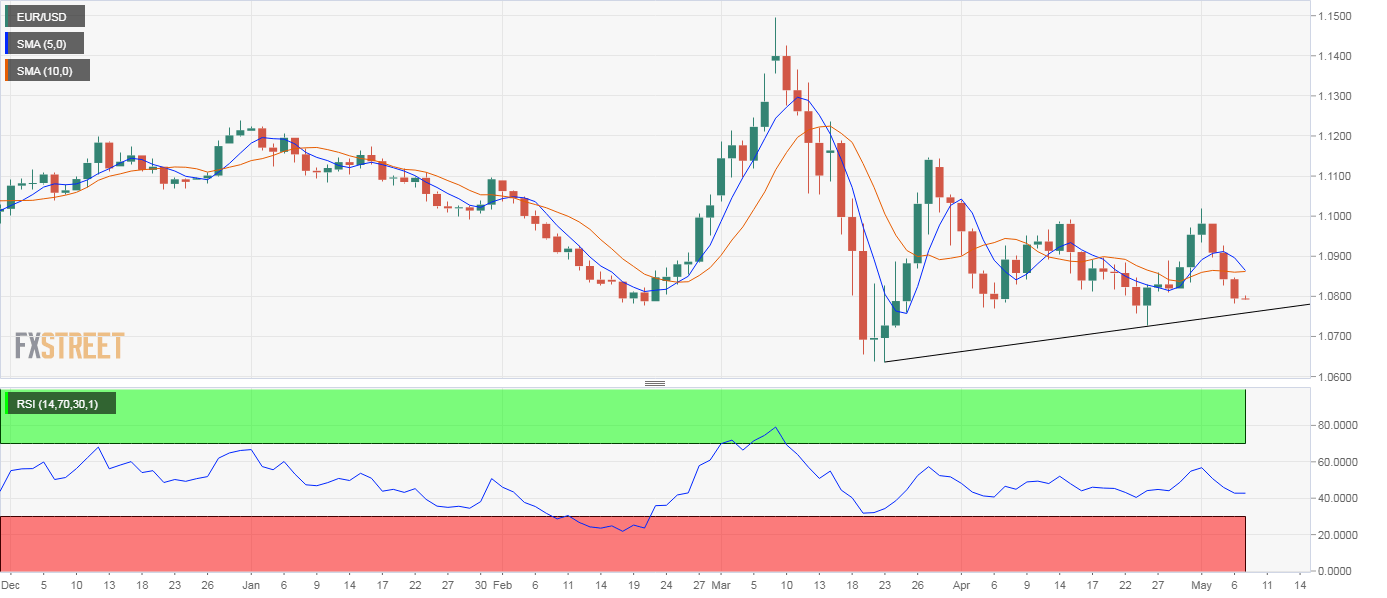
  • Short-term indicators are biased bearish and suggest scope for deeper retreat.

EUR/USD is hovering below 1.08 at press time, having dropped for the third straight day on Wednesday. 

With the sharp reversal lower from the May 1 high of 1.1019, the pair has reversed more than 75% of the bounce from 1.0727 and exposed the support of the trendline connecting March 23 and April 24 lows. As of writing, that trendline support is located at 1.0762.

The 14-day relative strength index is reporting bearish conditions with a below-50 print and the 5- and 10-day averages look set to produce a bearish crossover. Hence, a drop to the trendline support looks likely. Acceptance lower will likely cause more chart-driven selling, leading to a deeper slide to 1.07 and possibly to 1.0636 (2020 low). 

On the higher side, a close above 1.1019 is needed to confirm a bearish-to-bullish trend change. 

Daily chart

Trend: Bearish

Technical levels


US 10-year yield hits three-week high as treasury launches 20-year bond

The yield on the US 10-year and 30-year government bond yields rose on Wednesday after Treasury said it will launch a long-planned 20-year bond and m
আরও পড়ুন Previous

USD/JPY recovers from 106.00 as Tokyo begins the trading week amid risk-off mood

While extending recovery moves from the seven-week-low, USD/JPY takes the bids to 106.25 as Tokyo opens for the first time in a week.
আরও পড়ুন Next